
|
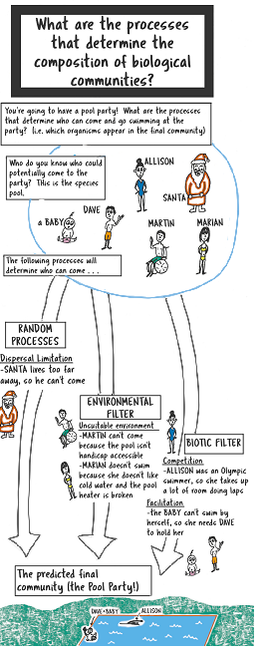
This visual shows the process of community filtering using the analogy of a pool party.
The species composition of the actual community of individuals (plants, animals, bacteria, etc.) at any given site is determined by several key processes (i.e. filters):
Each of these filters is in turn composed of several biological processes. These biological processes are explained with text in the visual, but instead of describing their effect on a species of plant or animal, I use the analogy of guests at a pool party. From the pool of guests who could potentially attend the party (the species pool), the final guests at the party are those who have passed through the various filters associated with the theory of filtering of biological communities. |

An illustration of community filtering, using a pool party metaphor. © 2018, Alice Stears
|
I study plant communities, but communicating this process using plants would rely on the reader having some pre-existing knowledge about the relative fitness of multiple plant species in variable environments, which is not something that the average reader knows too much about.
I initially drew the entire visual by hand, including the text, but moved to digitally rendered text in the final draft to help with readability. I also cleaned up the hand-drawn images using photo-editing software, and added text boxes and lines using the computer as well. My goal was to create an image that was quirky and unintimidating, but still clear. Hopefully the hand-drawn image in combination with computer-generated text is a good mix.
In future versions of this visual, I would like to try different orientations of the schematic—perhaps from left to right in a landscape view, or even as a circle? It would also be fun to make an animation of the process that I could use in presentations for general audiences.
I was inspired to make this image by schematics of community filtering that I have encountered in the scientific literature. These images are more diagrammatic and while helpful to the scientifically-literate reader, they are a bit enigmatic for use with a general audience. I hope that adding a relatable analogy and pictures helps the reader to understand what’s going on.
Peer-reviewed articles that contain schematics of community filtering:
- Rethinking Community Assembly through the Lens of Coexistence Theory. J. HilleRisLambers, P.B. Adler, W.S. Harpole, J.M. Levine, M.M. Mayfield. Annual Review of Ecology, Evolution, and Systematics 2012 43:1, 227-248
- A predictive model of community assembly that incorporates intraspecific trait variation. Laughlin, D.C., C. Joshi, P. van Bodegom, Z. Bastow, P.Z. Fulé. Ecology Letters 2012 15:1291-1299.
