

I study the Bighorn mountain moose herd in North Central Wyoming for my master’s degree. Specifically, I am researching moose habitat use and evaluating the condition of preferred willow habitat across the forest. This research will help managers gain a better understanding of available resources for the moose herd and other ungulates.
When I am in the field, I often run into people recreating and receive multiple questions about why I measure willow plants if I am studying moose. I find better ways to communicate my research with each and every encounter I have with the public. The Visualizing Science course I am taking at the University of Wyoming continues to provide concepts for effective communication with multiple audiences in order to share my science.
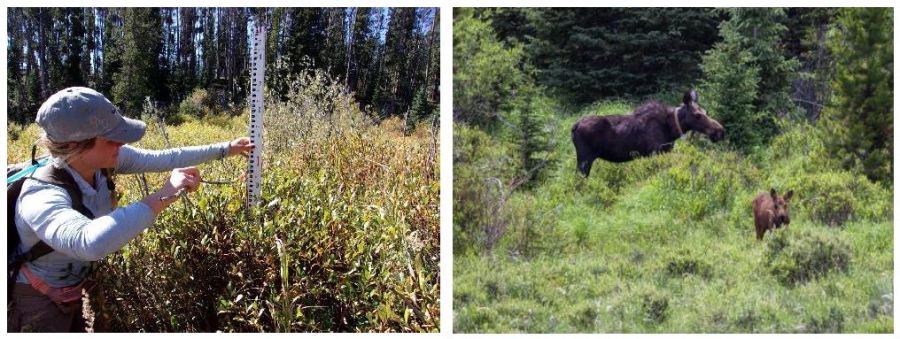
I referenced a few of the photographs I took during my field season this past summer in the Bighorn mountains. I wanted to show how I take willow measurements as well as display my study species. However, I struggle with drawing and had to reference ways of sketching cartoon moose. I found a great link that helped me to draw a cartoon moose in the first panel of my sketch which is referenced below with a link to their how-to website.
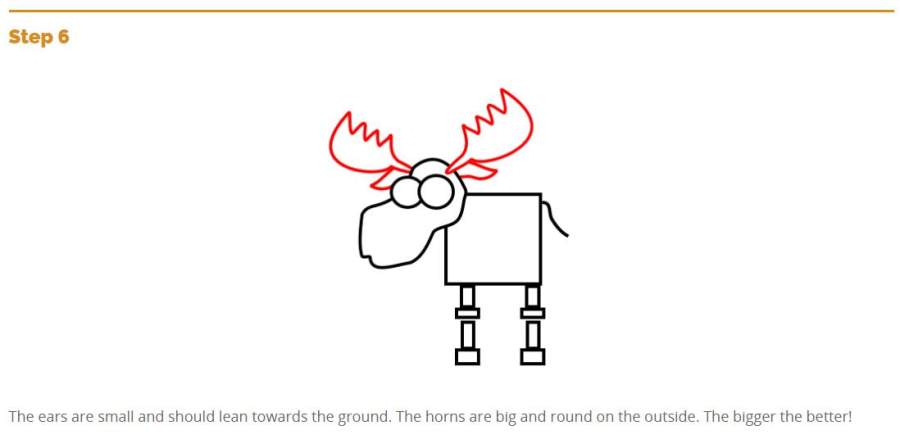
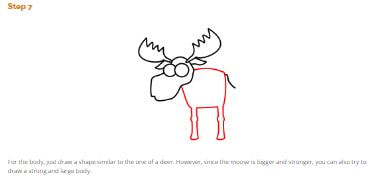
Screenshots of illustration from an online tutorial on cartoon drawing.
|
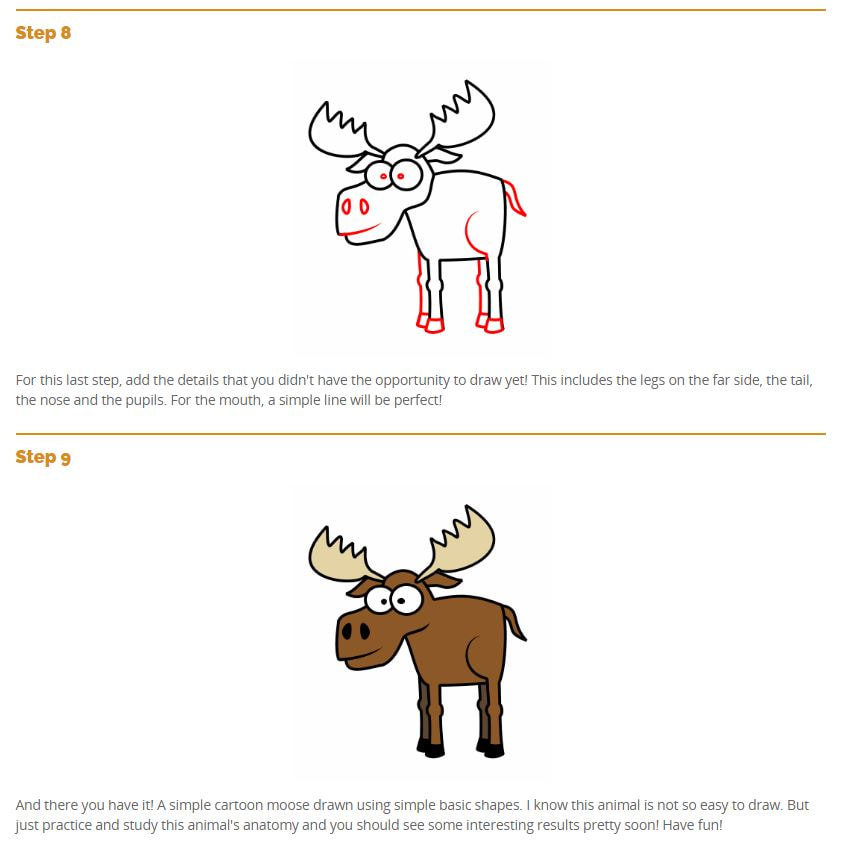
Image credit: © https://www.how-to-draw-funny-cartoons.com/cartoon-moose.html
|
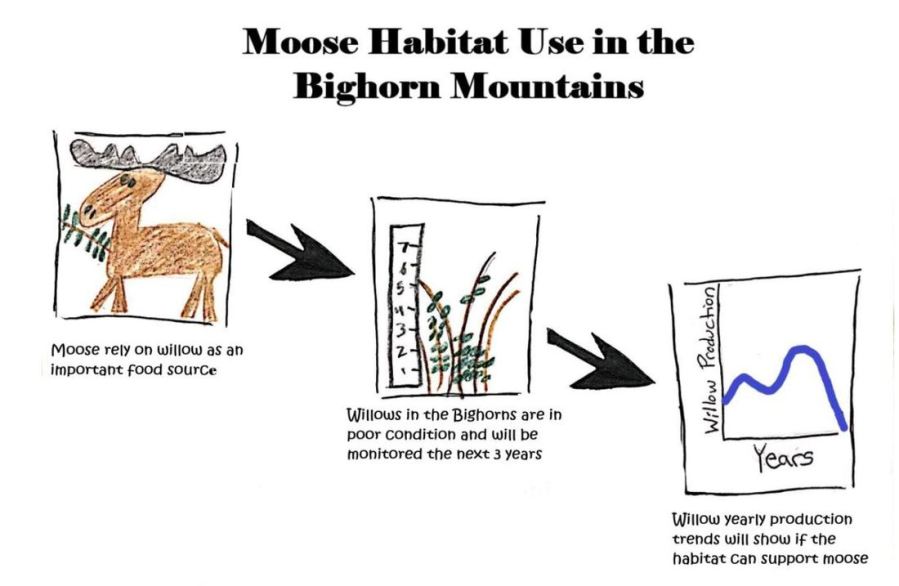
The importance of willow production is apparent in the sketch but I believe there is a disconnect between the 2nd and 3rd frame of the drawing. If I included one more drawing emphasizing why the willow may be declining (e.g., over browsing by ungulates, drought, disease), the audience may understand the final graph with less text. Another alternative would be to exclude the final graph of potential results to simplify the idea even further.
