
Post by Kylie Kolkman
Intro
Since 2009 there has been a tentative management project for prairie dogs in the Thunder Basin National Grassland in Douglas Wyoming. Prairie dogs are considered a keystone species in the area because of the multiple species that rely upon them as prey, their colonies change the landscape from them chewing down vegetation, and by keeping roots from being able to take hold in the soil where they dig their tunnels. But those holes for the tunnels are often a tripping hazard for livestock that can break their legs and then must be put down and ranchers lose profits. They also are carriers of Black Plague, which is a major health concern for the local community and the local ecosystem. Figuring out how best to manage this species has been a long and difficult struggle for the Forest Service and it doesn’t appear to have an end in sight1.
Systems Map
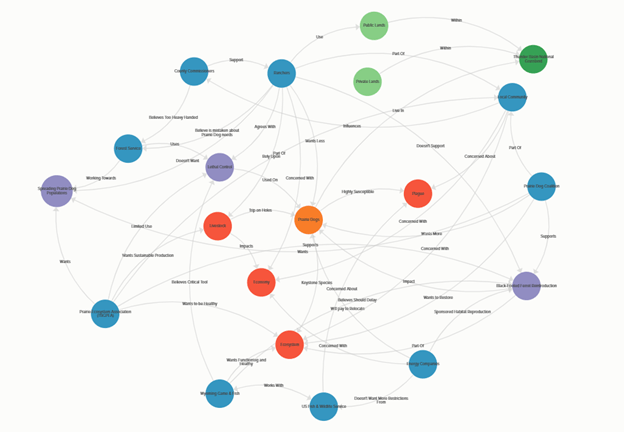
A systems map is used to show the dynamics and complex relationships within a management project. In science communication it can be used as added visual representation of a project’s relationships for ease of communication with the public. They are created with the intention of generating ideas and are not meant to be critical in its analysis of that project. When making a Systems Map, one should strive for dynamic complexity, rather than detail complexity. Science communication readers will find it more important to understand the dynamics of the situation rather than knowing every detail. Systems maps are meant to be easy to read and understand even by people who are not actively involved in the management project.
I was first introduced to the idea of a systems map in an environmental resource management class I took in the fall of 2021. That class was about learning to work collaboratively to make a decision in a complex situation. We were taught to use systems map to show the dynamic relationships of a management project and to use it to help us and others we are working with the see and understand those connections and relationships. I chose to make one for this management project to not only help visualize those relationships, but also to show the sheer size and complexity of this project and why one approach to a decision impacts so many different aspects of a management project through all of these connections and relationships.
To make a systems map, I first identified the central idea, the basis of the system. For this project it is Prairie Dogs in the Thunder Basin National Grassland. Once this is established, I identified the main subjects of the map, such as stakeholders and management actions. There can be as many or as few as needed, but the more detail provided, the better the system map can inform readers, especially those of a non-scientific mind. These main subjects should still be umbrella topics, so that connections to more detailed elements can be added. For this Prairie Dog project, anyone who has an investment in the issue, personal or professional, should fall under stakeholders. Anything that could be used to improve or maintain the management area could fall under management actions.
Finally, I connected the pieces of the map to each other. This should be done in a cohesive and organized way to allow clear communication of the information within the map. Not every piece of the map needs to connect to every other piece, but more connections will help readers understand hidden issues or connections that were previously unknown. Most importantly, the elements should be connected through strong verbs that clearly communicate the relationship between them. This listing and connection process will continue through all the main subjects of a management project, until it looks like Figure 1. Following these steps, I was able to create a very clear picture of the entire system, how it interacts with itself, the best way to manage it, and perhaps the best way to communicate these things to readers.
Ranchers
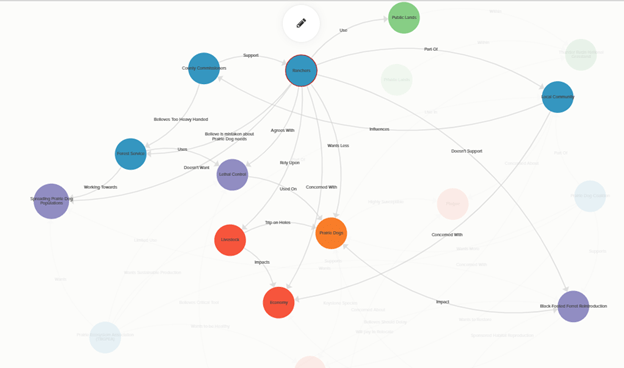
Figure 2 is a section of the systems map focusing on the stakeholder group Ranchers. They are connected to three stakeholder groups. The first being county commissioners by the support provided to ranchers from them as they decide the legislation that determines where and how the ranchers work. Second to the local community because they are members of the it and share in its concerns and goals. Finally, they are connected to the Forest Service by their own belief that the Forest Service is mistaken about prairie dog needs, particularly with habitat space.
Ranchers are also connected to three management actions. First by lethal control because Ranchers fully support and agree with lethal control of prairie dogs to prevent their population from growing, and even to reduce it by a small amount. Second, they don’t want the prairie dog populations to spread any further onto their grazing lands than they already are. They also don’t support the reintroduction of black-footed ferrets in the National Grassland because they believe they are not necessary to have in the area and they believe bringing them back would cause even more conflict with getting enough land for them to graze their livestock on1,3.
This analysis approach to reading a systems map, and making one for a management project, can help readers understand who, and how, each of these stakeholders are connected in a management project and understand some of the tensions between stakeholders and why they take the stances on issues that they do. However, it requires more time spent looking at the systems map and walking through each element and connection is the most effective way to see and understand the dynamic of the management project.
This systems map, and the analytical breakdown of the different connections and relationships, was created with the intention of helping the project’s working group, comprised of members of each of the stakeholders and convened by the Forest Service, to provide better advice on how prairie dog populations should be managed in the Thunder Basin National Grassland in Wyoming. Because the working group is made up of members from each of the described stakeholders it is intended to help them to better visualize and understand the different connections that they all have with each other that they may not have known about before. It is also intended to help them to understand how some of the previously proposed management actions and alternatives would affect those other groups, and why, through those newly visualized connections. This systems map can also be used by the public, or other involved parties who are not part of the working group, who want to better understand the connections and relationships of this management project. Especially for those in the Thunder Basin Grassland area or those who also have a prairie dog population to manage work with.
Kylie Kolkman is an undergraduate student in the Department of Zoology and Physiology at the University of Wyoming.
references
Brennan, B., & Kolkman, K. (2022, March 4). Discussion with Working Group Convener Bailey Brennan. personal communications.
Clement, J., & Glendenning, S. (2015). Thunder Basin Nation Grassland: Situation Assessment and Process Recommendations. Laramie, WY: Ruckelshaus Institute.
Western, J. M. (2016). Thunder Basin Collaborative Learning Workshops report. Laramie, WY: Ruckelshaus Institute.
