

Even my fellow ecologists often do their best to stay away from the word with a ten-foot pole.
As someone who finds genetics work fascinating, this reaction confuses me.
So, I set out to make a visualization that could explain some of the work that I do in a non-terrifying, non-overwhelming manner. Sure, the intricacies are complex and the math is complicated. But, surely there must be a way to explain the techniques I use in my research in a friendly manner, no?
Because they’re SO COOL.
I chose to create a visual of coalescent-based demographic reconstruction. And after reading that, you probably understand the eyes-glazing-over reaction. This is a method that both my advisor and the Molecular Ecologist Blog have referred to as “magic,” demonstrating that even those in the field could use a little explainer to help them understand it.
To make a long story short, this method allows us to catch a single fish today, sequence its genome, and estimate how many fish were in its population going back to before humans even existed.
Did I say it’s cool?
Because it’s cool.
But how do I explain this in a simple graphic? I chose to use a comic-type format, as this allows me to use several images to covey the information and to use a caption in each image to explain what’s going on.
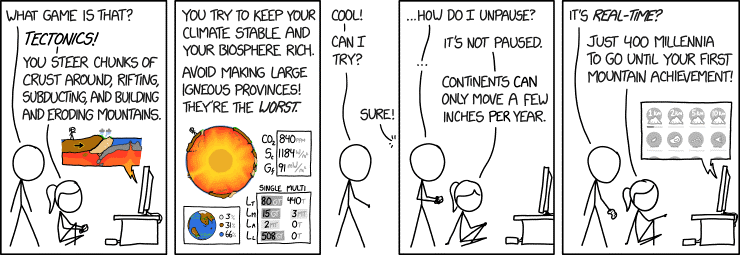
In exploring the scientific comic world, there were two comics that I was pretty drawn to: xkcd and redpenblackpen, both of which use very simple drawings, with a limited color palette.

A simple, cartoon-ish fish that served as inspiration for the simple kissy-lipped fish in my comic (Credit: pixabay.com, CC0 1.0)
|
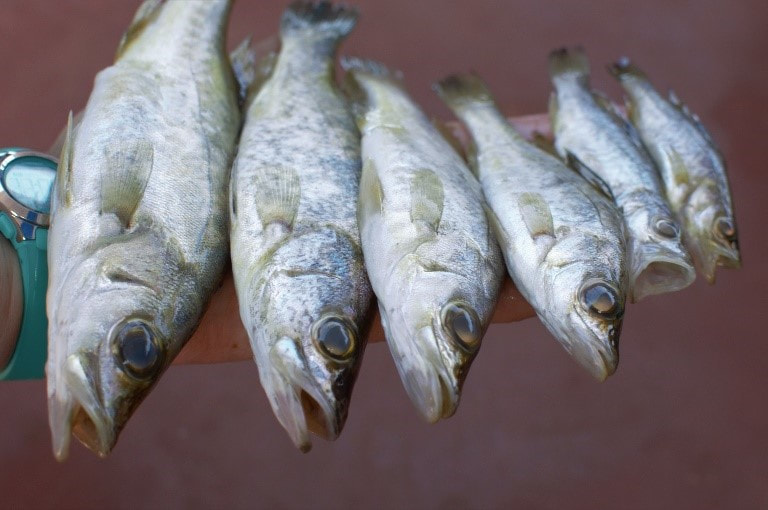
Some of the fish species I study, which served as the original inspiration (Photo ©Jessica Rick, 2018)
|
Brainstorming for and refining this comic has helped me to think about clear, concise ways to describe my research, which is an invaluable experience. In addition, comics are a great way to make science friendlier and more approachable, and this is a great tool to now have in my SciComm toolkit.
If you have questions or suggestions, or would like to know more about my research, head on over to http://www.jessicarick.com or find me on Twitter @jessi_rick.
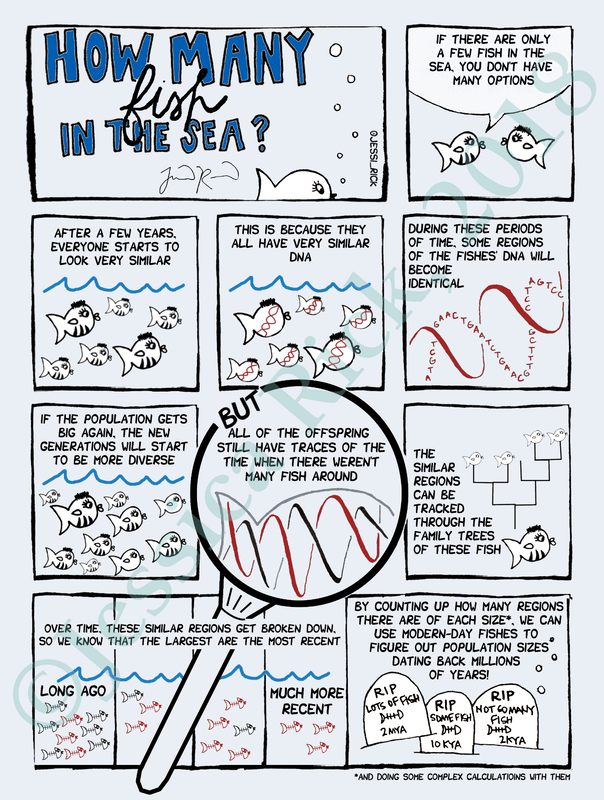
Title: How many fish in the sea?
Two fish; one tells the other: “If there are only a few fish in the sea, you don’t have many options.”
Six fish: After a few years, everyone starts to look very similar.
Six fish; stripes have been replaced with red strands of DNA across bodies: This is because they all have very similar DNA.
Red strands of DNA weave together across the frame: During these periods of time, some regions of the fishes’ DNA will become identical.
Ten fish: If the population gets big again, the new generations will start to be more diverse.
Big magnifying glass fills surrounds next frame, crossing into adjacent frames. Handle runs down to the bottom-left corner of the whole comic. Visible at the bottom of the magnifying lens is the tail fin and back of a fish, with red and black DNA strands weaving through its body: BUT – all of the offspring still have traces of the time when there weren’t many fish around.
One fish, at the bottom of a family tree; branches lead to other fish that don’t have the same markings: The similar regions can be tracked through the family trees of these fish.
Lots of fossil fish, implied by skeletons: Over time, these similar regions get broken down, so we know that the largest are the most recent.
Three tombstones. Left one reads “RIP lots of fish, 2 MYA.” Middle reads “RIP Some fish, 10 KYA.” Right reads “RIP Not so many fish, 2KYA.”: By counting up how many regions there are of each size*, we can use modern-day fishes to figure out population sizes dating back millions of years!
*And doing some complex calculations with them.
